
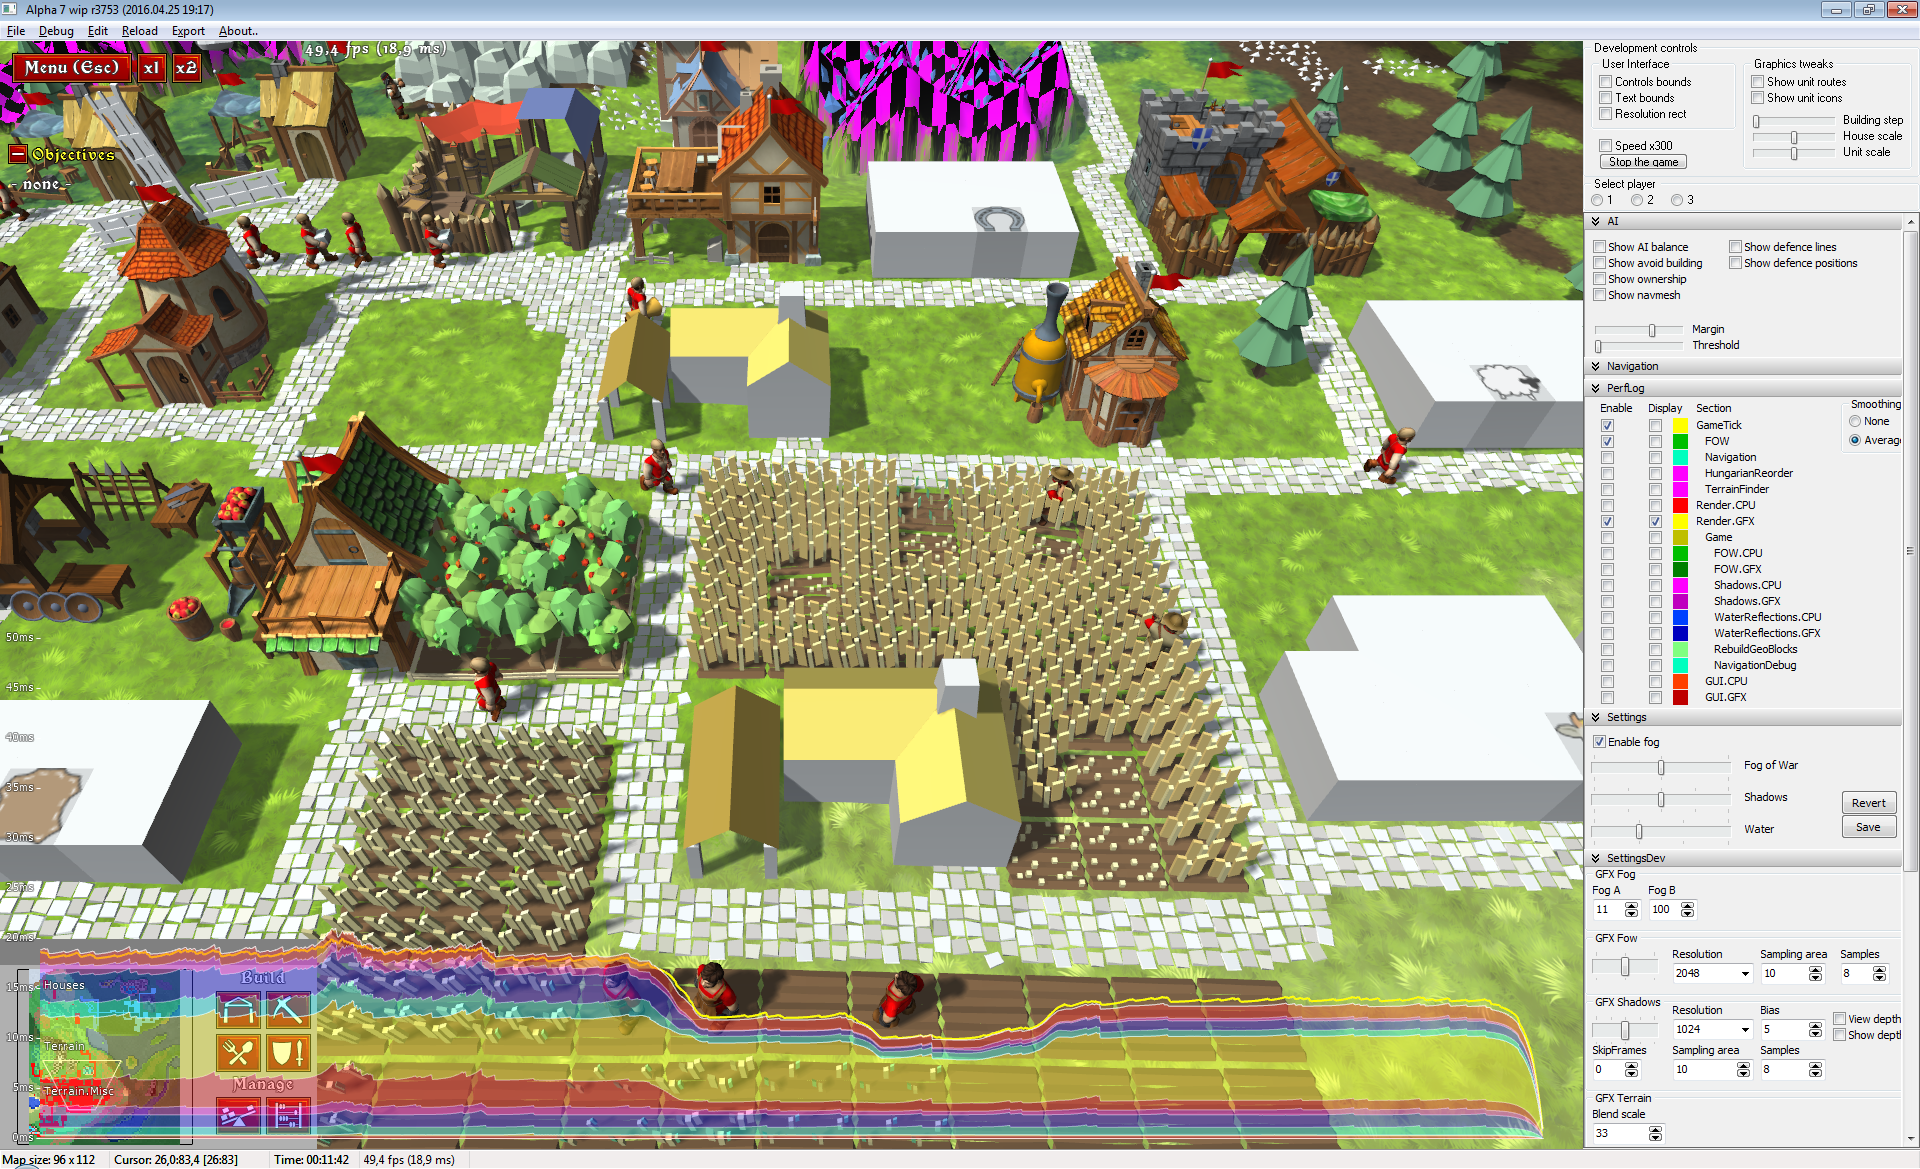
Rigged those fancy-looking performance charts today. Each section is part of the total frame render time. As you can see, example frame gets rendered under 20ms (equals to ~50fps). Most of the time is spent in rendering of terrain and houses. This will be invaluable tool to deal with rendering optimizations! 🙂
New buildings look fantastic
Thank you!
Those houses are still placeholders, they need a lot of improvements )
If i can ask, when will be a new update?
I can not say for sure, but probably near the end of May.
Alpha 7 release date?
No date yet. Hopefully around end of the May
Looks amazing! Cheers to the team for this awesome work! Too bad that my old laptop cannot run it, as I only have OpenGL 2.0. Looking forward to seeing more updates though.
Thank you for your work!
Thanks for writing! Glad you like it 🙂